 Bron Thulke - Web Developer
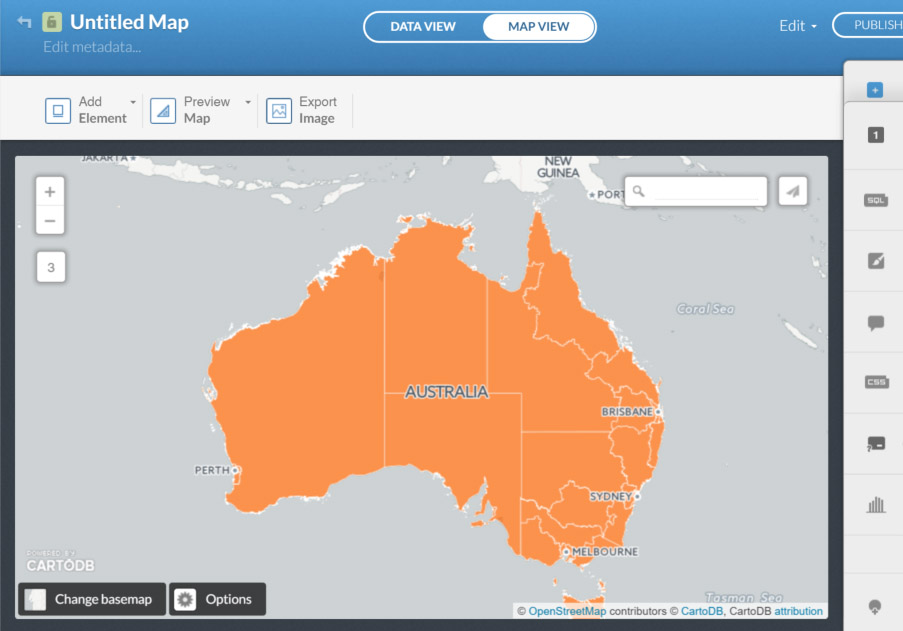
Mapping Shapefiles with CartoDB
I’ve done a lot of work with Google Maps over the last few years, and when the CartoDB service came up on my radar a while ago I was intrigued, but the projects I was working on all had a “rushed” timeline on them which meant it was never a good time to play with a new system… until recently!
Now admittedly I actually never used the Google Maps Engine, I just used Google Maps Javascript API for my work as it was mostly related to showing things on a map and drawing shapes, nothing “overly complex” (in my mind, at least). So the news that the Google Maps Engine was being discontinued didn’t really affect me much, but when I had a requirement land on my desk to display large shapefile data on a map, suddenly it did matter to me.
In order to display this data in my Google Map using the Javascript API, I had to convert the shapefile to KML files for each region being mapped (which I did using QGIS), but the KML files were very large (some over 20MB in size), and the way the Google Maps API was using these was to download the file to the client’s browser and then push it up to Google. For files over around 8MB in size it just didn’t work, and for those under that it was very slow.
Enter CartoDB.
I will openly admit that I almost cried when I created my first dataset in CartoDB and used it to create a map. It was so easy that I couldn’t believe I’d overlooked this service for so long. The Map Academy that they provide introduces you to the basic (and then advanced) topics of using the system, so I do recommend starting there and having a play, but in this post I’m going to run through the process of using a shapefile zip.
I’ve found a lot of government organisations provide geographical data in varying formats, the most common one being this ERSI Shapefile. The shapefile format is a popular geospacial vector data format for geographic information, and typically comes in a ZIP file which must at least three mandatory files - a .shp file, a .shx file and a .dbf file. So that is what we’re going to import here.
First thing’s first, sign up
CartoDB have a free plan, which worked great for me for this first project as we won’t have too much data or traffic (it’s an internal app). On the free plan you can’t have private maps, but the information we were mapping is publicly available, so the client was happy with the map being publically available.
So jump on and sign up, noting that your username will become your subdomain - for example mine is bronsquire.cartodb.com.
Once you’ve signed up, you’ll be taken to your dashboard.
Creating a new dataset using an ERSI Shapefile ZIP
Once you’ve signed up, the first thing it guides you to do is create a new map:
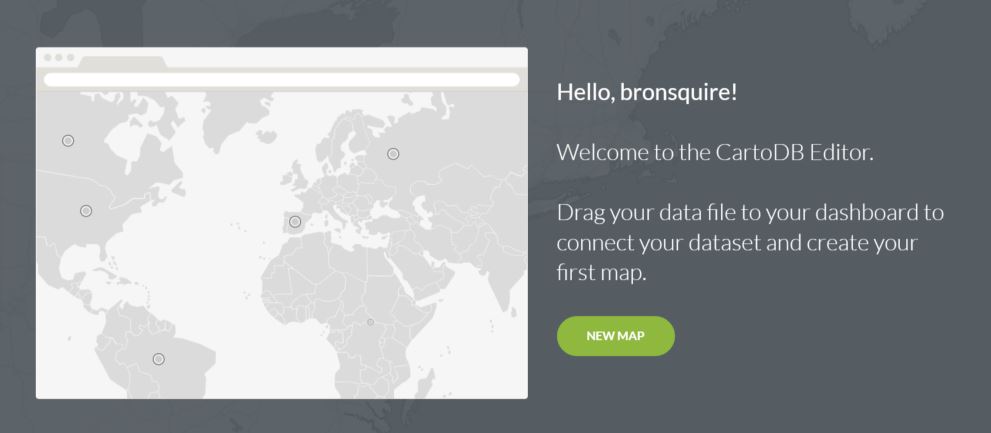
Click “New Map”. You will be asked to add a dataset (which is the data you plan on mapping) - you’ll have the choice to connect your own or use a public one from their Data Library:
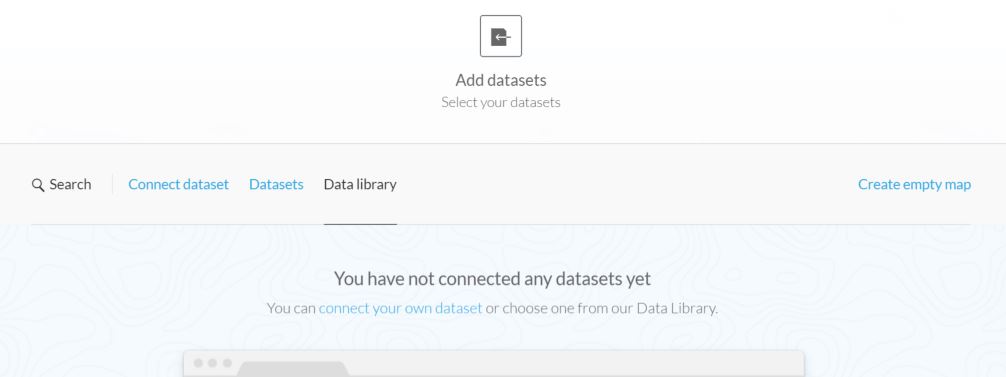
Incidentally there are some COOL datasets in the Data Library, but for what we are doing here click “Connect your own dataset”.
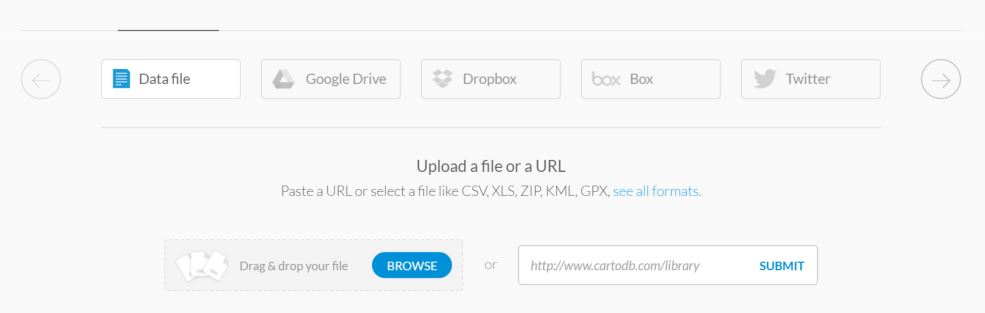
You’ll be taken to a page where you can select from various locations for your data file (there are some great connectors here!), or you can upload your own file. Note that KML would work, too, if that’s what you have:
You have the option (the check box at the bottom of the screen) to let CartoDB guess the data types on import. I’ve always done this so far and it’s been spot on. I’m assuming it would be easy to change them if it got anything wrong, or just simply start over and uncheck the option next time.
Click Browse to find your .zip file, or drag and drop it into the area in the page, then click the big green “Connect Dataset” button to start the upload (this doesn’t seem obvious at first, as it’s right down the bottom).
The file upload will commence, and a progress window will show at the bottom of your browser, and it may seem like it’s happening “in the background” but since this is uploading the file I’d suggest leaving the tab open until it reports that it’s complete.

This process may take a while depending on the size of your file, so maybe go and make yourself a coffee (or pour a champagne, because you’ll want to celebrate the awesomeness of CartoDB at the end of this).
Once the upload is complete the progress bar will show that it is importing, and a short time later you will be taken to your new map - voila!

At the top you can flick between Data View and Map View - the data view is just the tabular data:
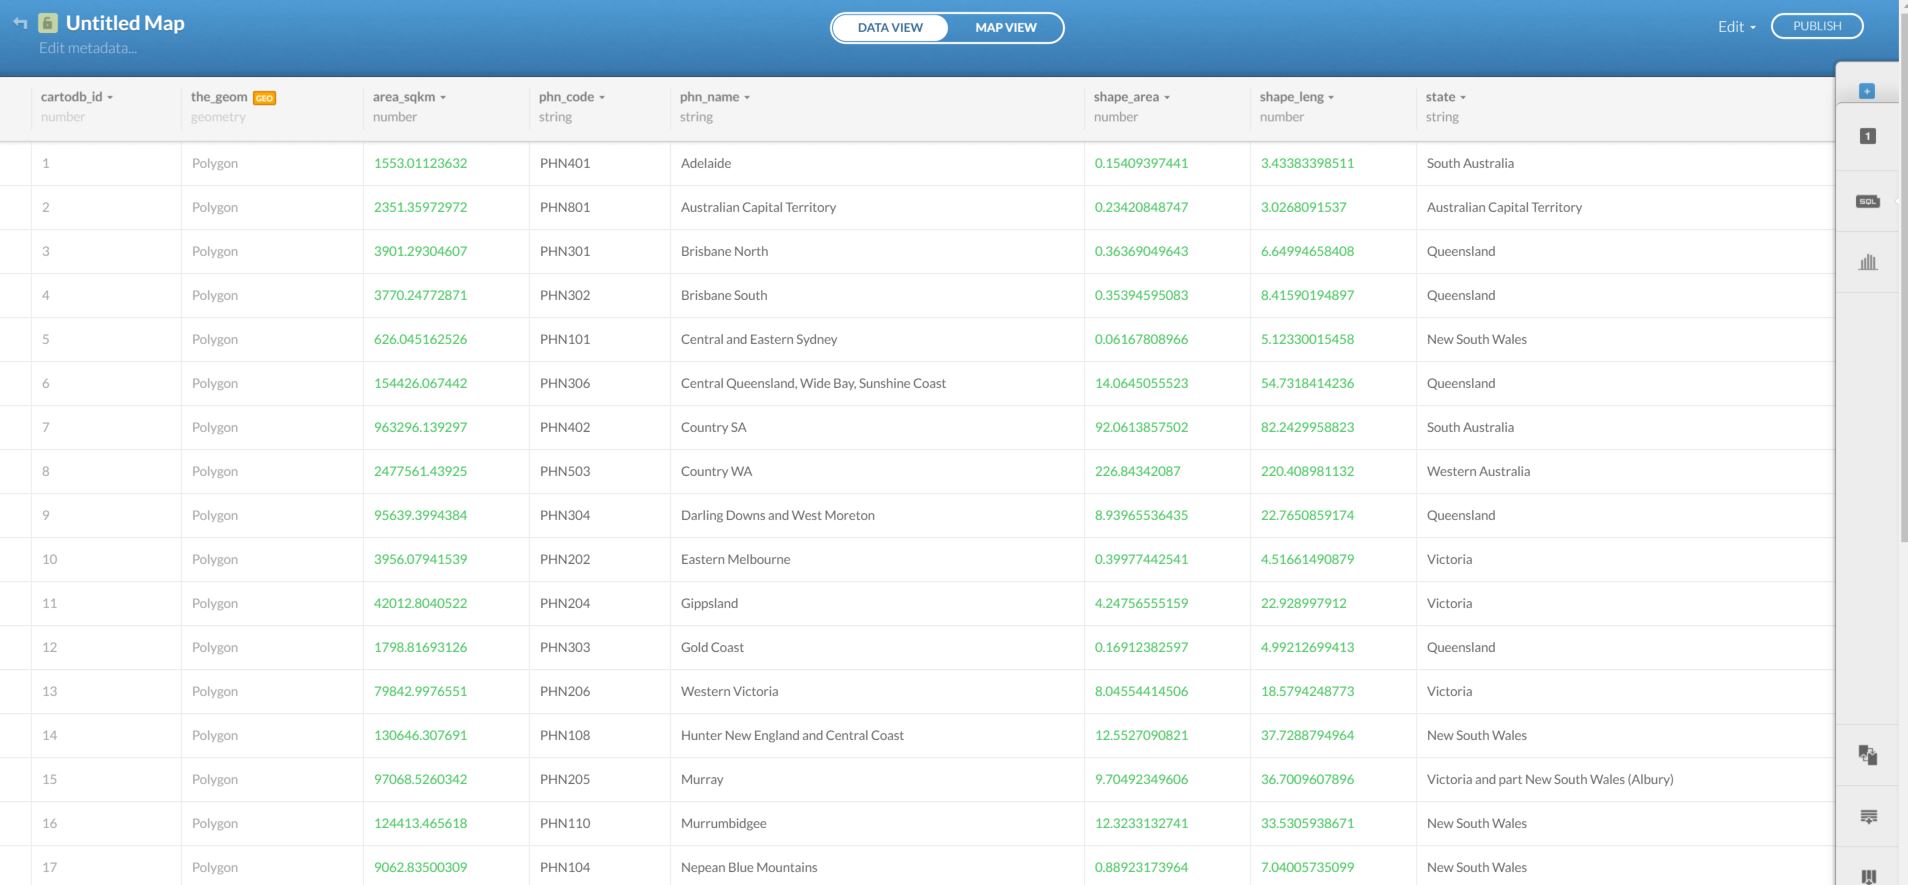
If you actually important a CSV or other table format data, that’s what you’d see here. However, because this was a shape file that we imported, what we are seeing are all the properties for each shape that was imported, based on the shapefile’s schema.
At the right hand side you’ll see some tabs to start customising your map (the look and feel, infowindows etc), and querying specific data. And so the trip down the rabbit warren begins - have fun!
My next step was actually to set up my existing Google Map on my site to include this CartoDB map as a layer within (as my existing map shows other data already from a Google Drive doc - that’ll be the next step in this migration for me). That will be the topic of another post in this series, coming soon!
If you’ve found this helpful and would like to see more posts about particular topics in relation to setting up CartoDB, please shout at in the comments or connect with my via Twitter. In particular I’ll be posting soon about creating custom Infowindows.